It’s pretty simple. Usually, your odds of turning about 40% of the prospects you advertise to into your customers is ZERO. That’s right, ZERO. They are a complete waste of your time and money and we can prove it with your data. The odds aren’t much better for another 40% of the prospects you advertise to – their odds increase to around 1% (over 7 years!). There is a small pocket of prospects (usually 15-20% of your market that actually buys the products and services that keep you in business. And Stochastic Marketing knows who they are. The secret to more effective, efficient marketing is knowing which prospects (even though they have the right demographics, in the right homes) will buy from SOMEONE ELSE NOT YOU and redirecting your sales and marketing dollars on the prospects you can turn into high value customers without throwing money at them. Stochastic Marketing’s data model and MEER Score report will calculate your odds, zip code by zip code.
The root word for “Stochastic” is a Greek word Stochos which translates roughly as “one who aims well. That’s why our logo looks like the cross hairs on a scope. Stochastic modeling is a type of statistical modeling that finds patterns in random numbers. Like Stochastic models in other industries, we use data analytics to identify the prospects who are most likely to buy from a contractor, what are your odds of turning a prospect into a customer and what they should be worth as individuals.
We’ve analyzed the contractor sales from more than 70,000,000 contractor visits to homes. That includes more than 300 demographic attributes like home ownership, the age of the home, vehicles owned, age of homeowner, presence of children in the home, financial metrics and the types of advertising media they are likely to be influenced by.
The result is a data model that identifies the 60% of the homeowners who are most likely to buy replacement HVAC systems, water heaters and other products sold by contractors in general and more importantly – the odds that they will buy from an individual contractor. In addition, our data model can identify the maximum potential sales for an individual contractor in individual zip codes as well as similar prospects and zip codes that are more likely to buy from a contractor’s competitors than the contractor in question.
You may have heard the old IT saying “Garbage In Garbage Out” or GIGO. Our first step in generating a Marketing Efficiency & Effectiveness Review report is scrubbing your data to remove duplicate addresses and commercial transactions. We will ask you for a minimum of seven years of invoice data in a txt, csv or xl format. If the data comes from two or more computer systems we will bring all those invoices into a single file, de-dupe the records to eliminate duplicate accounts (e.g. multiple First/Last Names for the same address), commercial addresses as well as what we perceive to be rental property (e.g. billing goes to one address, services are provided at another address).
Many invoices will be “no charge” invoices for estimates or various methods for billing for service agreements or registering equipment warranties those invoices are filtered out our revenue analysis. Our clean-up process has dealt with more 70 million contractor invoices. If your data is available to you, odds are we can clean it up.
The Marketing Efficiency & Effectiveness (MEER Score) report is focused on comparing your sales/marketing results from residential customers. Many contractors include new home construction, service/repair/replacement work in rental properties or “light” commercial work in strip malls, small offices etc. These can be a significant portion of your annual sales or none at all. If a billing address shows that you have billed $30,000 or more to a single address, we will typically remove that address from our analysis and treat it as a “commercial” customer.
In most industries, Alpha Charts are used to track the value of their typical customer relationship over the life time of that relationship. A client’s Alpha Date is the very first day that the customer did business with the company. Every subsequent transaction or donation is tied to this first “Alpha Date”. In political or non-profit fundraising the goal is get an initial donation-however small- and keep the customer donating more frequently at increasing amounts over time. In this example, the value of the long-term relationship increases over time. Financial services companies like brokerage houses or insurance companies take the same approach. Catalog marketers operate the same way. Start small, build a relationship and sell them more over time.
In these industries, long-term customer relationships build value over time.
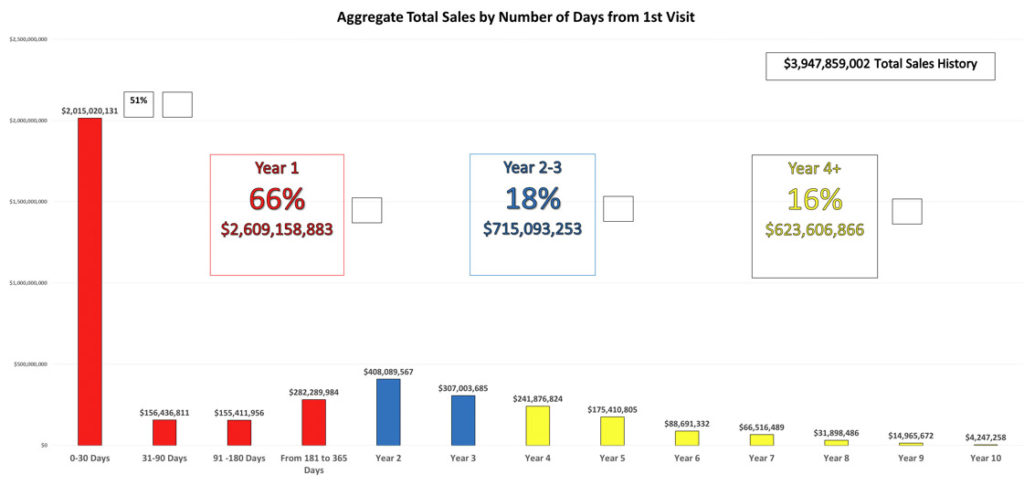
In the home service industries like HVAC or Plumbing, the OPPOSITE is true. If you (like Stochastic Marketing) take more than $7 Billion of contractor revenue, and tie very penny of revenue from an address to the first date the contractor did business with the home, you find that more than 50% of the revenue from the home, for the trade in question changes in hands within thirty days of the first visit. On average, more 66% of the revenue changes hands within 365 days of the first visit to the home.
There is NO evidence that HVAC or Plumbing contractor’s businesses main engine for growth is long-term customer relationships. If that were true, as contractors who have operated in markets for 20 even 30 years would at some point (beginning in year 15) begin growing at an exponential rate as clients with HVAC systems or water heaters begin their second replacement cycle and are added to a contractor’s yearly new customer production.
The Alpha Chart provides contractor’s with a management tool and easy action item for managing their customer management performance. On average, fifty-percent of a customer’s life-time value changes hands within 30 days of your first visit to their home. Using HVAC customers as an example, on AVERAGE a new customer should have spent about $1200 within 30 days of your first visit to their home and about $1600 within the first year. Evaluate what every new customer has spent with you 31 days and 366 days after your first visit to their home. If your averages are below these numbers, your sales will be below average as well.
This is the industry average Alpha Chart from over $5 Billion dollars of residential HVAC sales
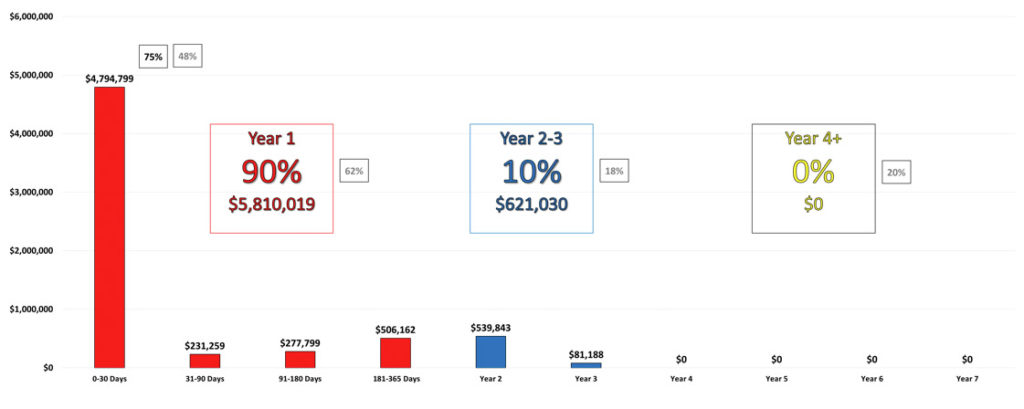
This is a typical Alpha Chart for an HVAC contractor who is growing.
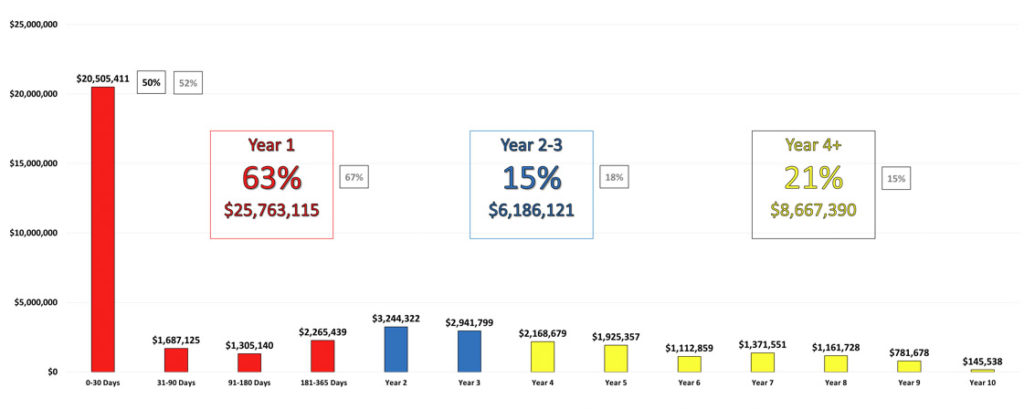
This is a typical Alpha Chart for an HVAC contractor who has not been growing for five or more years.
One of the traditional four “P’s” of Marketing (Product, Place, Price & Promotion), Place – or where you do business with your customer is a critical predictor of contractor sales/marketing success (or failure).
A residential HVAC or plumbing contractor’s service area will typically include between 50 and 120 zip codes if he operates in a metropolitan area and has sales between $1MM or $10MM per year.
Sales & marketing results will vary DRAMATICALLY from zip code to zip code from all forms of advertising despite identical mass media, websites, weather, age of homes and home owner demographics.
Super Primary Zip codes are zip codes where the contractor sells more than $500,000 a year.
Primary Zip codes are zip codes where a contractor sells more than $100,000 a year but less than $500,000 a year. Your odds of turning a homeowner into a customer in a Primary Zip code averages 7% over 7 years.
Secondary Zip codes are zip codes where the contractor sells between $100,000 and $10,000 a year. Your odds of turning a homeowner into a customer in a Secondary Zip code averages 1% over 7 years.
“Other” zip codes are those zip codes where the contractor sells less than $10,000 a year. Your odds of turning a homeowner into a customer in an “Other” Zip code averages 0% over 7 years.
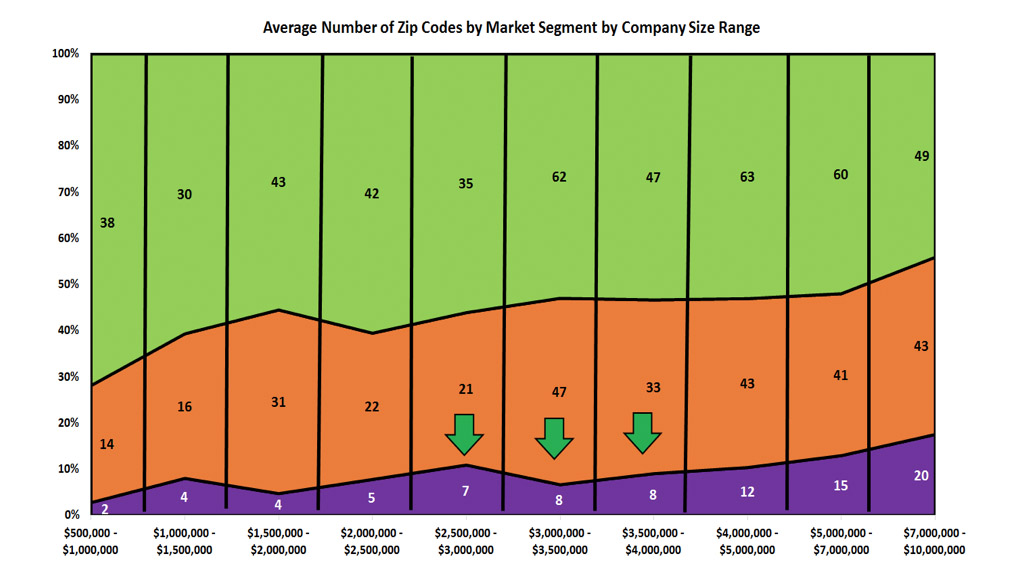
In the image below, along the bottom axis you will see values for the size of HVAC contractors. The numbers in purple show the number of primary zip codes where a contractor that sells more than $100,000 per year in residential HVAC. Above that, in orange is the number of zip codes where that size contractor sells between $100K and $10K per year.
In green, you see the number of zip codes that your vans drive to waste their time and your money. You sell $10,000 or less per year in these zip codes.
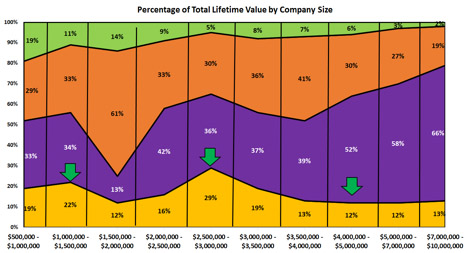
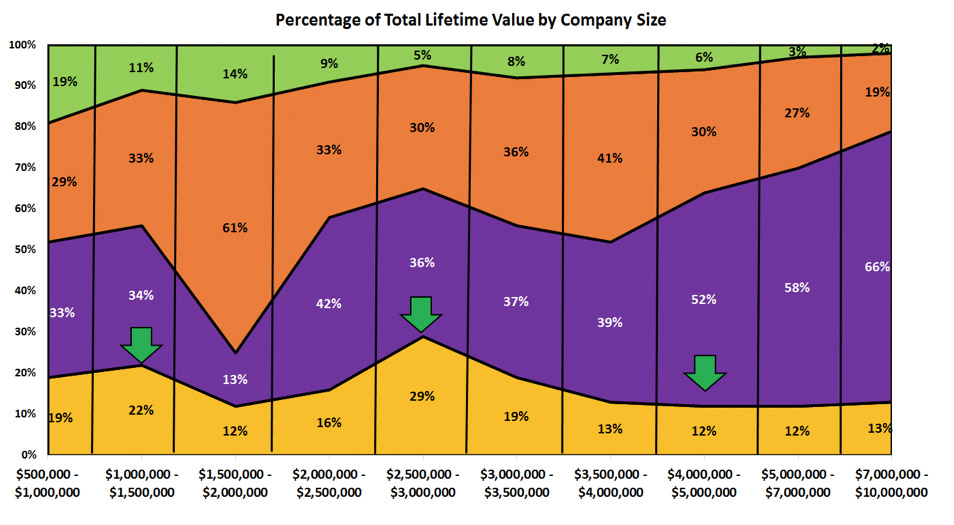
The chart below, along the bottom axis you will see values for the size of HVAC contractors. The percentages in purple show the percent of the contractor’s total sales that come from primary zip codes. Above that, in orange is the percent of sales that comes from Secondary Zip codes. Above that, along the top is the tiny fraction of your sales that comes from MOST of the contractor’s zip codes, his or hers “Other” zip codes. Using the Pareto principle (also known as “the Bell Curve” this sales concentration by zip code (or place) is exactly what you would expect and applies to HVAC, Plumbing or Roofing contractors.
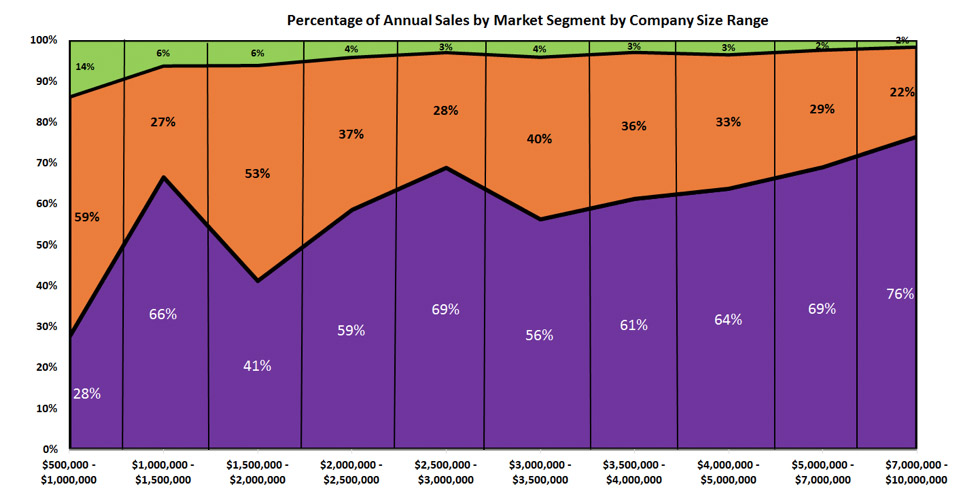
As a simple, actionable goal, look at the bottom axis on the image shown below. Find the size contractor that you want to be. In the yellow band above the bottom axis you can see the percent of sales than an average contractor that size gets from a SINGLE zip code. As an example, if you want to be a $5MM HVAC contractor then you ought to do what a typical $5MM contractor does and that is sell 12% of our sales or $600,000 in ONE zip code. A $600,000 zip code is a SUPER PRIMARY zip code.
A typical $3MM contractor does 19% of their sales in a single Super Primary zip code ($570,000 per year).
In every MEER Score we compare every invoice generated in the most recent 12 months against your customer file. All of the customers who have shown up in your records for the first time are considered to be New Customers. Your Average New Customer Value is the total sales to these customers divided by the number of new customers produced in the most recent 12 months. The Alpha chart tells you how quickly (on average) they will spend their money with you. Your MEER Score will tell you how much your Average New Customer is worth and how that compares with other contractors the same size across the country and in your region. Typically, new customers are worth 200 – 300% more than an Active Housefile customer and are two to three times as likely to buy a replacement system as an existing Housefile customer or Service Agreement customer.
Your “Housefile” or customer file is comprised of customers who showed up in your invoice records more than 365 days from your latest MEER Score report. An “Active Housefile” customer is a customer that you did business with more than 365 days prior to your latest MEER Score report AND did business with you (was an active customer) during the 12 month period covered during the MEER Score report period in question. Active Housefile customers are usually worth $700 (about 40% of a new customer).
A customer is defined as a “New Customer” for 365 days from the first day that address shows up in your billing records. On average, new customers (including replacement and non-replacement customers) are usually worth $1,600 – $1,800 or about 200 – 300% more than an Active Housefile customer.
For many decades, companies that sold via direct mail catalogs, fundraisers and more recently e-commerce companies were able to “match back” every order to the catalog, letter, e-mail blast or coupon that generated that sale or donation. For organizations like these, a match-back analysis, that tied sales from the client to the marketing channel that generated the sale or donation was fairly straightforward.
Contractors however, typically require one or more visits to the home to make the sale. Letters, billboards, radio ads may trigger a visit to a contractor’s website and a phone call using the general telephone number on the site. Tracking numbers alone won’t accurately tie the marketing that triggered the inquiry to the contractor’s annual sale. In Stochastic’s Matchback Analysis, every contractor invoice is tied to the modeled prospects that we did or did NOT mail to during the most recent MEER Score report. With each MEER Score a Matchback Report is generated for every mailed zip code that displays the number of new customers produced (mailed and un-mailed) and Active Housefile customers (mailed and un-mailed) for that period AND previous periods so we can track if we are producing incremental new customers who value is higher than customers that we did NOT mail to. Your sales performance is compared to other contractors who are mailing the same modeled new and Active Housefile customers during the same and previous periods. This will tell you, how your sales performance stacks up against other contractors who are in front of similar prospects.
Mathematically, this ratio is one of the most important ratios in your business. It is important because it acts as a productivity measurement for your advertising and sales results and tells you how many techs you need to grow your business to your goal. The lower the number, the fewer techs and employees you need to maintain to support sales growth. It is defined as the number of non-replacement households visited divided by the number of replacement households visited in the most recent 12-month period. Ratios for new customers, active house-file customers and service agreement customers are usually significantly different.
On average, a contractor will do business with 6.5 non-replacement households for every 1 replacement household. Contractors with replacement efficiency ratios in the best 20% will only need to go to 5 or fewer non-replacement households for every 1 replacement household sold.
Every contractor that we have measured with sales over $10,000,000 a year (residential HVAC) has a replacement efficiency ratio below 6. The most efficient contractor we have measured had a ratio under 2 (and also has the highest average household value because his efficiency ratio is so low).
Other things being equal, the lower your replacement efficiency ratio, the higher the average household value is to that contractor.
This is a typical Replacement Efficiency Report for ALL contractor customers.
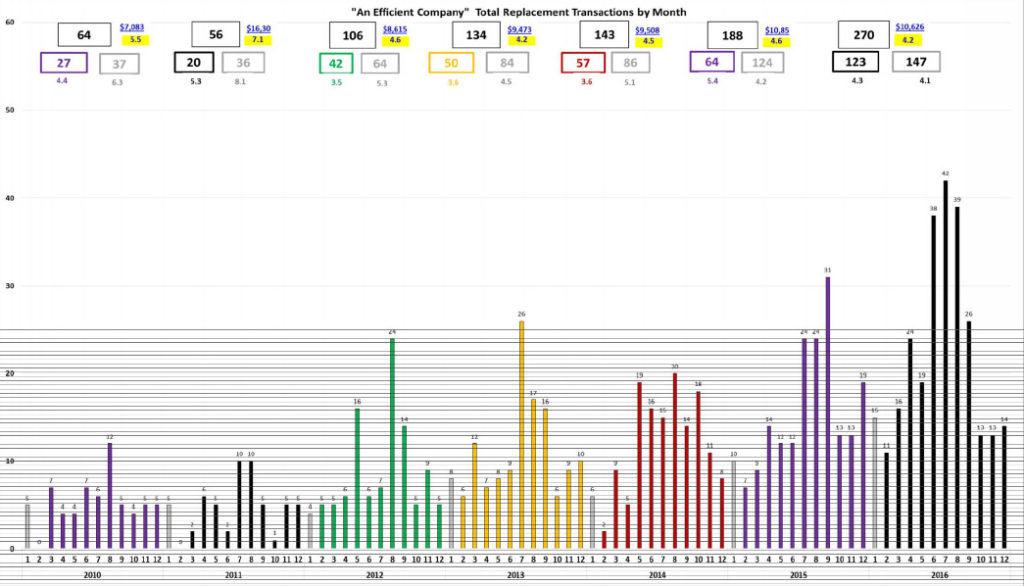
Across the bottom of the chart you see the years covered by the report with bar graphs showing the number of replacements sold each month. In order to compare month-month numbers for the most recent year with previous years, the months from this calendar year are highlighted in color, the same months for previous years are highlighted different colors for each year.
Across the top of the chart you see groupings of thee boxes. The topmost box shows replacements sold during the applicable year. The rightmost upper box will show replacements sold year to date.
To the right of the topmost box, underlined in blue is your average replacement value for the year in question. Highlighted in yellow is your replacement efficiency ratio – or – the number of non-replacement households you visited PER single replacement household.
A complete replacement efficiency report provides a break down for a contractor’s overall company, new customers, House-file customers, and Service Agreement Customers.
Almost always, the household who is MOST likely to buy a replacement system is a New Customer, NOT a household that you have a long-term relationship with. Usually, the new customer replacement efficiency ratio is 2-3 times better than Housefile Customers and 3-4 times more efficient than Service Agreement Customers.In order to calculate the value of your AVERAGE value of your customer home during a period run this calculation:
((average replacement efficiency ratio X value of your average non-replacement household) + Average Replacement Value)) Divided by (average replacement efficiency ratio + 1) = The value of your average household.
Mathematically, the replacement efficiency ratio is the most important ratio in your business, its’ more important than average service ticket or average replacement value.
Included with your MEER Score is a CS score for each zip code. CS is our short hand for a financial modeling term called “Common Size” that uses multivariate regression analysis to identify the maximum observed annual sales for an individual contractor operating in a zip code with a similar number of Stochastic Modeled prospects who own homes built in roughly the same period. The CS score allows a contractor to compare their recent sales levels in a zip code with the potential sales that other contractors have reached in a zip code with a similar number of prospects owning similar homes.
We assign $10,000 of contractor to every CS score point – up to a maximum of $2,000,000 per year for a single contractor in a single zip code. Selling $2,000,000 a year in a single zip code is very rare, almost as rare as a .400 batting average in Major League Baseball. In most metropolitan areas there are several zip codes with a CS score above 200, 300 even 600. In zip codes where CS score are above 300, there are so many homes on a first-time replacement cycle that several contractors will sell nearly $1,000,000 per year (about 125 replacements per year) in that zip code.
If you sell $250,000 per year in a single zip code (about 30 replacements) with a CS score of 100 you are a prominent contractor with an established market presence. If your advertising is only generating $250,000 a year in a zip code with a CS score over 400 your “branding” isn’t working very well. In all likelihood, several of your competitors are selling 2 – 3 times as much as you.
Comparing your sales, zip code by zip code against the CS score for those zip codes is a realistic, proxy measurement for how effective your advertising (and sales performance) is doing compared to the many competitors in that zip code.
To calculate your Average Life Time Customer Value, divide your total residential sales by the number of unique customers over a seven-year period and you will have your Average Life Time Customer value. The national average (over seven years) is $2337. Typically, 53% of the homes that a contractor does business with never spend more than $500 (the average for those customers is under $200) and the contractor in effect loses money when you consider the marketing costs required to generate that customer and the labor needed to visit the home.
Contractors with the highest Average Life Time Customer Values usually have a high average new customer value and/or a percent of customers who have spent less than $500 around 40% (they are good at getting back into homes). The larger the percentage of your overall sales that comes from Primary or Super Primary zip codes, the higher your Average Life Time Customer Value will be.
Contractors operating in coastal California and the Mid-Atlantic states will typically have REPLACEMENT values that are 30% above the national average. Contractors operating in the Midwest and Southern Markets will have replacement values slightly below the national average while contractors operating in Texas and Western states (outside of California will have replacement values in line with the national average.
There is no significant difference nationally in the value of non-replacement life-time customer values (or the percent of customers who spend less than $500).
In an effort to answer the question (are homeowners who buy replacements “different” than those that don’t?) Stochastic performed to a life style/ demographic study of homes that did or did not buy a replacement system from contractors. We appended 45,000,000 individual data elements to a randomized sample of over 65,000 replacement HVAC systems and over 87,000 non-replacement customers between January 1, 2015 and June 2016.
We looked at Demographic and Life/Style Interests.
- Life Events like New Movers, Job Changes, New Parents, Empty Nesting, Retirement
- Interests like Sports, the Arts, Gardening, Music
Buying Activity on Cars, Houses, Computers, Clothes, Household Items, Boats - Financial metrics like Income, Owner vs Renter, Credit Cards, Mortgages
- Personal and Household Characteristics like Married vs Single, Age of Household & Education Level.
Based on their individual data, every replacement or non-replacement customer could be placed in one of seventy categories based on Personix’s Life/Style Interests categories. What we found, is that there is no demographic difference between homeowners who buy replacements and those who don’t buy replacements.
There are however, often surprising differences between the types of homeowners that your advertising is turning into prospects and your sales people are successfully selling to (and if they are selling at the price they should be selling replacement systems for. Many contractors show bias in advertising or sales performance for or against – homeowners over 65, Millionaires, Affluent No Kids, Upper Mid Class with Kids, etc. Stochastic’s Personix report can uncover these bias where they exist, determine their effect on your sales and make suggestions on how to attack under exploited market potential.
As a simple, actionable goal, look at the bottom axis on the image shown below. Find the size contractor that you want to be. In the yellow band above the bottom axis you can see the percent of sales than an average contractor that size gets from a SINGLE zip code. As an example, if you want to be a $5MM HVAC contractor then you ought to do what a typical $5MM contractor does and that is sell 12% of our sales or $600,000 in ONE zip code. A $600,000 zip code is a SUPER PRIMARY zip code.
A typical $3MM contractor does 19% of their sales in a single Super Primary zip code ($570,000 per year), if you aren’t a $3MM contractor yet, focus as much advertising as possible on a single zip code and selling over $570,000 a year in that single zip code.
One of the challenges contractors face when sharing their data in a mix group is adjusting for regional price/cost differences. These can be caused by differing homeowner demographics, cost of living or regulatory differences.
Even within a region, one contractor may operate in a more rural, more affluent, less affluent area within the region. This local market difference (e.g. how do your top 10-20 zip codes compare with another similar contractor) can have a dramatic effect on your average replacement value.
Here is the average replacement value by region based on more than $5 Billion dollars of residential HVAC sales.
- Mid-Atlantic Region – $10,272
- South Region – $7,628
- Midwest Region – $7,273
- Texas – $8,692
- Western States (excludes CA) – $8,692
- California – $12,638
Get a FREE Marketing Efficiency & Effectiveness Review (MEER)
Learn how successful your marketing and sales efforts are in generating new customers, see how that compares with similar contractors, and identify your opportunities.